Vessel Morphology and Blood Flow

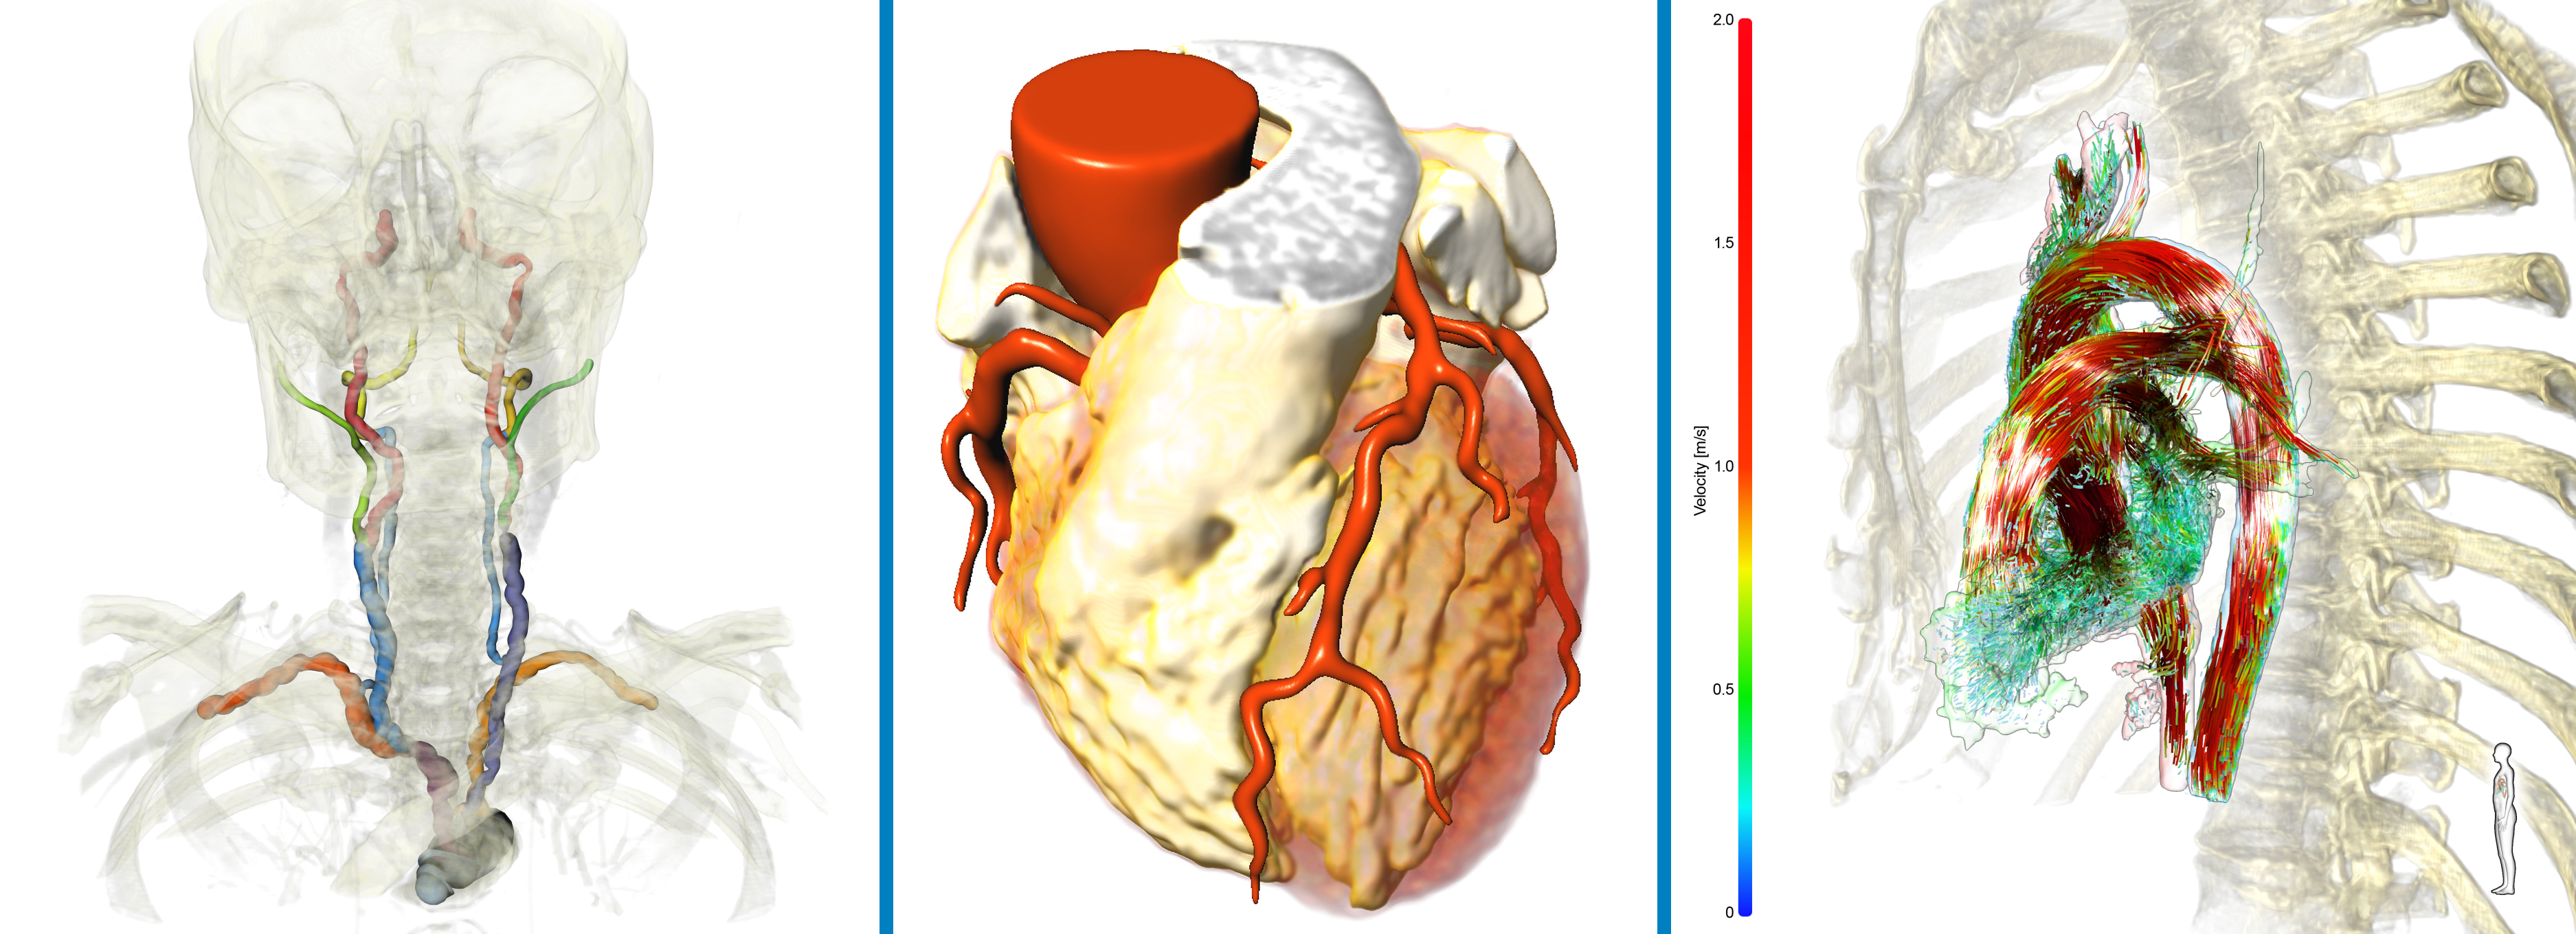
Clinical Challenges in the Diagnosis of Vascular Diseases

The assessment of local vasculature and hemodynamics is essential for a variety of tasks related to diagnostics and therapy planning. It can be based on anatomic and functional image data from US, CT and MRI. The complex and complementary data can be acquired to assess structure, vessel wall and plaque morphology as well as blood flow patterns. The combination of the complex multimodal image data towards the assessment of disease patterns and progression is challenging. It raises the need for meaningful visualizations as well as quantitative measurements in order to support detection, assessment and follow-up inspection of diseased vascular regions.

Solutions & Technologies

© Fraunhofer MEVIS
Web-based solution for the quantitative assessment of carotid stenosis degree.

Software Support for Complex Vessel Analysis

Fraunhofer MEVIS develops automatic and interactive solutions for analysis and visualization of vessel structures from multidimensional image data. Quantitative biomarkers that can be derived provide information about vessel lesions as well as related hemodynamics. The solutions are integrated into platforms and workflows tailored to specific clinical questions.


Segmentation and Lumen Quantification

Fraunhofer MEVIS has developed vessel tracking algorithms including the tubular tracking approach that won the MICCAI challenge for coronary artery tracking. The lumen quantification for stenosis assessment has been successfully applied in multicenter studies with multimodal angiographic data.


Follow-up and Multimodal Result Comparison

In order to enable the comparison of measurements from different modalities or follow-up examinations, Fraunhofer MEVIS provides customizable matching-, labeling and reporting concepts.

Analysis of Blood Flow and Pressure Distribution

Specialized processing techniques for 4D PC MRI flow data enable the preprocessing as well as visual and quantitative analysis of vascular hemodynamics.

Connectivity and Flow Patterns

Based on a flow pattern matching vortices can be detected and analyzed regarding spatial and temporal features. Connectivity between vascular regions can be calculated based on the detection of connecting paths. The analysis considers the uncertainty caused by image noise.

Pulse Wave Velocity and Wall Shear Stress

For the assessment of vessel wall stiffness and shear forces interacting with the vessel wall, different parameters can be extracted. The pulse wave velocity is derived from the temporal shift of flow curve features along the vessel course. Shear forces acting on the vessel wall are calculated for the complete vessel surface and can be quantitatively analyzed at user-defined vessel crossections.

Pressure Maps

The relevance of stenoses can be calculated noninvasively based on the measured flow velocities. The software supports the analysis of pressure differences along the vessel centerline as well as visualizations of the pressure distribution in 3D.

Blood flow in the heart 4D PC MRI dataset
© Fraunhofer MEVIS
Representation of different aspects of blood flow in aorta such as connectivity with the brain, flow velocity, distribution to different branches, pressure and vorticity.