Clinical challenge
Alzheimer’s disease (AD) is an epidemiologically highly relevant neurodegenerative disease. It is the most common type of dementia accounting for approximately 60% of all dementias world-wide. The generally increasing life expectancy in the western world in combination with a highly increased incidence of AD from the 65th year of life onward, it is expected that by the year 2050 approximately one in 85 people will be affected by the disease globally. Until now, there is no cure for the disease. However, research on disease modifying therapies is being pushed heavily with a variety of pharmaceutical studies and pre-clinical trials currently being conducted. In order to assess the efficacy of potential drugs, clinical or imaging biomarkers are required. One such biomarker is provided by amyloid PET imaging. ß-amyloid plaques are known to play a critical role in the process of cellular decline in the gray matter of brains affected by AD. Accumulation of these plaques progresses over time and is expected to begin already several years prior to the onset of clinical symptoms. As a result, amyloid PET imaging holds high potential in both early detection as well as monitoring of the course of the disease.
Solution
Currently, there are three Flour-18 labeled amyloid binding PET tracers in development. One of these is Florbetaben (FBB), for which our software solutions have been optimized. Interpretation of images acquired with FBB requires the reader to undergo thorough training in order to learn and understand the image characteristics. The tracer has a lipophilic character, which causes it to bind unspecifically to white matter brain tissue. ß-amyloid plaques however accumulate only in the cortical gray matter areas of the brain. Consequently, for pathological cases the tracer will also accumulate in the gray matter areas. The challenge with reading such images lies in answering the question how far the FBB-signal extends from the white matter into the cortex. This question is relatively simple to answer for highly pathologic case, where high signal is observed throughout the brain. But for beginning cases this requires an experienced reader to evaluate. Also, it requires some efforts to draw quantitative measures from such images without the use of specialized algorithms. These measures, however, are essential for monitoring the progression of the disease and eventual therapy response, i.e. during the course of clinical trials.
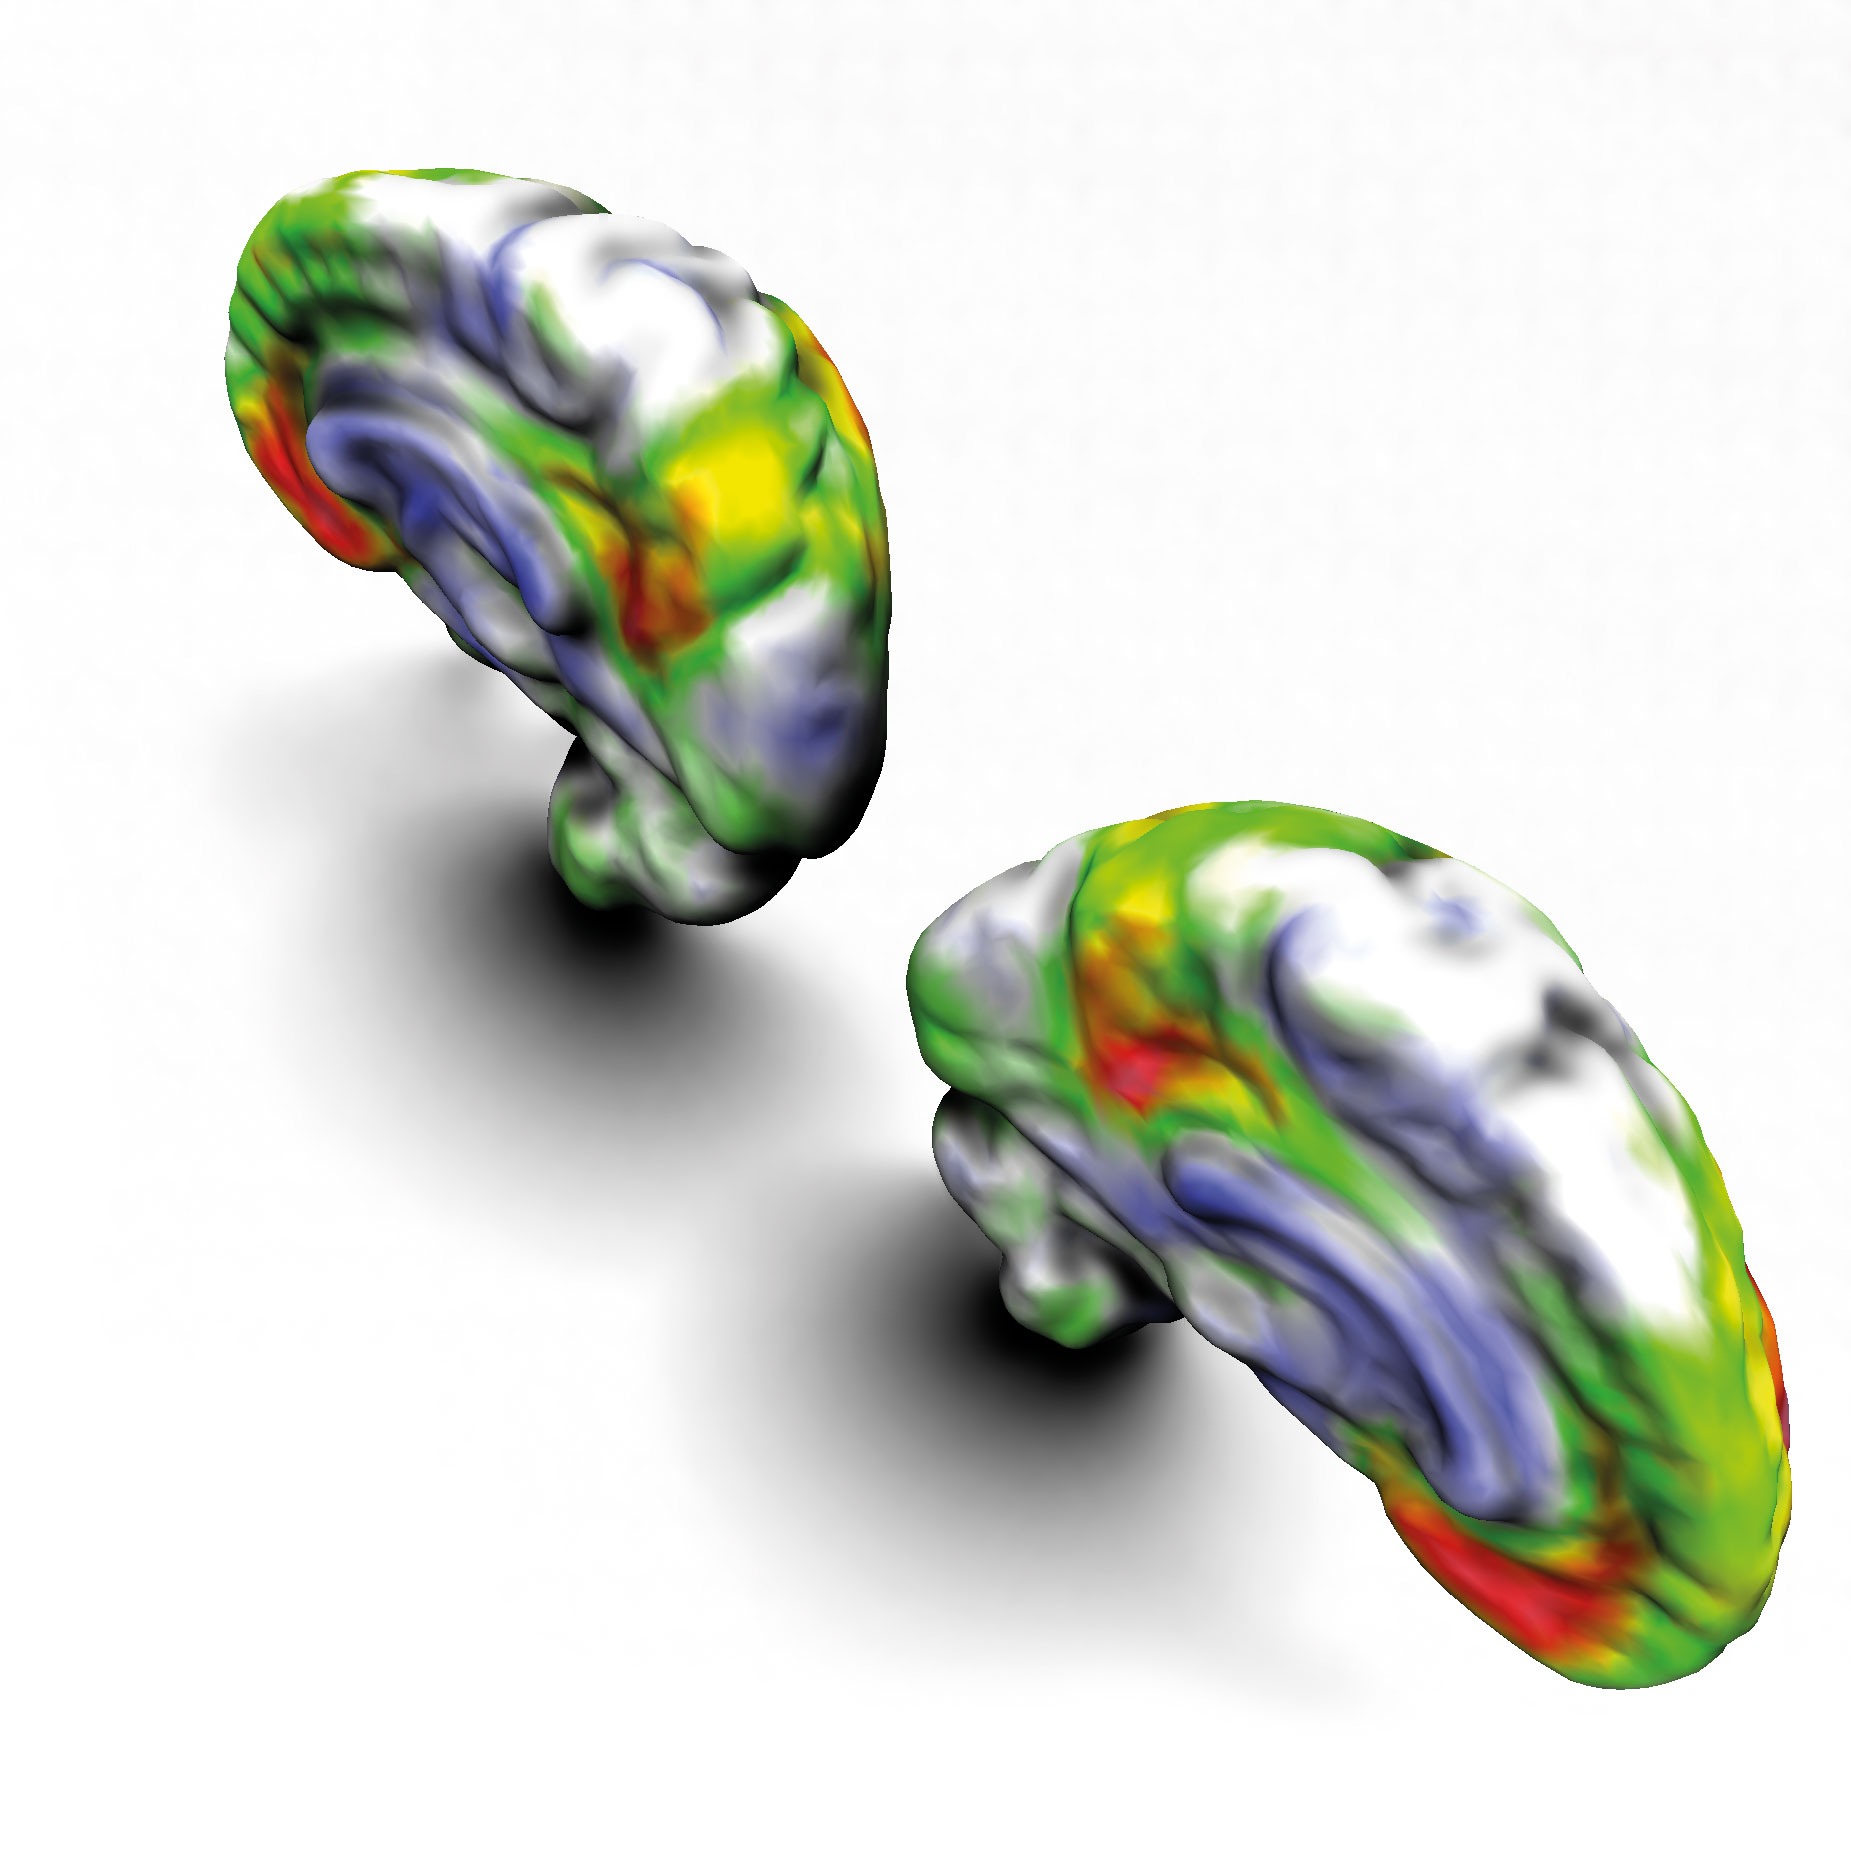
To facilitate this process, a statistical analysis method is applied which is based on an approach initially developed for the analysis of FDG-PET brain scans. Here, instead of directly interpreting the PET image itself, the image is compared to a normal template. A simple statistical z-test is performed for each voxel of the image in question, which yields the amount of deviation from the normal group in terms of standard deviations. In the nuclear medicine community, this is typically referred to as a z-score. Such resulting z-score images can be either visualized using false colors for simplified qualitative interpretation, or they can be quantified over regions-of-interest within the brain.
References
Amyloid Analyzer - A software assistant for qualitative and quantitative analysis of Florbetaben PET scans
Weiler, F. et al. VMLS 2013, 61-64, DOI: 10.2312/PE.VMLS.VMLS2013.061-064
 Fraunhofer Institute for Digital Medicine MEVIS